Do all children in the world have the same chance to go to school? The answer is not simple. This chart can help us understand the situation:
It shows how access to education is different in various parts of the world. Some numbers are very high. Others are much lower.These differences are important — and they tell us something about the world we live in. Before you continue, revise how to recognise chart types and describe trends: Essay Structure and How to Understand Statistical Data
Now study the key vocabulary you need to describe charts and trends.
remain level — [rɪˈmeɪn ˈlevəl] — stays the same; does not change; paliek nemainīgs
increase dramatically — [ɪnˈkriːs drəˈmætɪkli] — goes up very quickly and by a large amount; strauji palielinās
fall steadily — [fɔːl ˈstedəli] — goes down slowly and regularly over time; pakāpeniski samazinās
fall dramatically — [fɔːl drəˈmætɪkli] — goes down very quickly and sharply; strauji samazinās
rise steadily — [raɪz ˈstedəli] — goes up slowly and regularly over time; pakāpeniski palielinās
Tip:
rise / increase — go up
fall — go down
steadily — slowly and evenly
dramatically — quickly and strongly
rise / increase — go up
fall — go down
steadily — slowly and evenly
dramatically — quickly and strongly
Describing Change (basic verbs)
decrease — [dɪˈkriːs] — to become less, or to make something become less; samazināties
drop — [drɒp] — go down quickly; strauji samazināties
fall — [fɔːl] — to become lower in size, amount, or strength; samazināties
go down — [ɡəʊ daʊn] — to be reduced in price, value, amount, quality, level, or size; samazināties
grow — [ɡrəʊ] — increase over time; pakāpeniski pieaugt
increase — [ɪn'kriːs] — to become larger in amount or size, or to make something do this; palielināties, pieaugt
No Change
remain stable — [rɪ'meɪn 'steɪbl] — stay constant; būt stabilam
remain unchanged — [rɪ'meɪn ʌn'tʃeɪndʒd] — not change; palikt nemainīgam
stay the same — [steɪ ðə seɪm] — not change; palikt tādam pašam
Nouns for Trends
fall — [fɔːl] — a decrease; kritums
rise — [raɪz] — an increase; pieaugums
downward trend — ['daʊnwəd trend] — general decrease over time; lejupejoša tendence
upward trend — ['ʌpwəd trend] — general increase over time; augšupejoša tendence
Talking About Amount of Change
decrease by — [dɪ'kriːs baɪ] — go down by a number/amount; samazināties par ...
increase by — [ɪn'kriːs baɪ] — go up by a number/amount; palielināties par ...
Comparing Data (Here revise what you studied about the comparison degrees back in form 7: Comparison Degrees – Different Structures)
higher than — ['haɪə ðæn] — greater in value; būt augstākam nekā
less than — [les ðæn] — a smaller amount; būt mazākam nekā
lower than — ['ləʊə ðæn] — smaller in value; būt zemākam nekā
more than — [mɔː ðæn] — a greater amount; būt vairāk nekā
the highest — ['haɪɪst] — the biggest value in a group; būt visaugstākajam
the lowest — ['ləʊɪst] — the smallest value in a group; būt viszemākajam
Describing Differences and Similarities
a big difference — [bɪɡ 'dɪfrəns] — a large gap; liela / būtiska atšķirība
a small difference — [smɔːl 'dɪfrəns] — a small gap; neliela atšķirība
similar — ['sɪmələ] — almost the same; būt līdzīgam
the same as — [ðə seɪm æz] — equal in value; būt tādam pašam kā
Talking About Numbers
amount — [ə'maʊnt] — quantity; daudzums, apjoms
figure — ['fɪɡə] — a value; skaitlis, cipars, kvantitatīvs rādītājs
number — ['nʌmbə] — how many; skaits
percentage — [pə'sentɪdʒ] — part out of 100; procentuālais daudzums
Task: now study the model example to see how this vocabulary is used naturally to describe our chart.
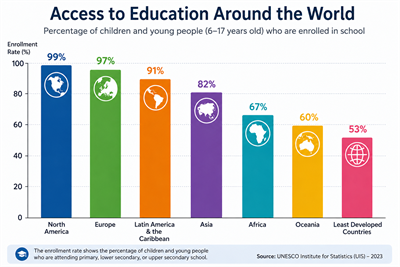
The bar chart shows the percentage of children and young people aged 6–17 who are enrolled in school in different regions of the world.
The highest percentage can be seen in North America, where the figure reaches 99%. Europe is slightly lower than this at 97%, while Latin America and the Caribbean also has a high percentage of 91%. By contrast, the lowest figure is in least developed countries, where the percentage is just 53%.
There is a big difference between the regions. For example, Africa has a much lower figure (67%) than Asia, where the percentage rises to 82%. Oceania is also lower than Asia, with a figure of 60%. These numbers are not similar, and overall they show a downward trend when moving from more developed to less developed regions.
Overall, it is clear that access to education is not equal around the world. The percentage is highest in more developed regions and becomes lower in less developed areas, which highlights an important global issue.